Same metric, asked from a chat window, a dashboard tile and an API call. Same number three times.
On Tuesday we mapped the semantic layers every major platform now ships, and ended on an uncomfortable point: a definition that is consistent inside one platform is still only consistent inside that platform. Three governed numbers that disagree with each other aren’t governance. They are a more confident version of the old problem.
This post is the practical answer: how to build a single source of truth for metrics that people, dashboards and AI agents all share. We’ll take one metric, ask for it three different ways in Equative Insights OS, and show what happens underneath. Then we’ll change the definition once and watch all three follow.
We picked a win rate because every commercial team has one and very few agree on it. Sales may count every opportunity that reached proposal. Finance may only count deals that turned into booked revenue. Operations may want duplicates and test records out. Each version is defensible. Running all three at once is how a pipeline review turns into an argument about arithmetic.
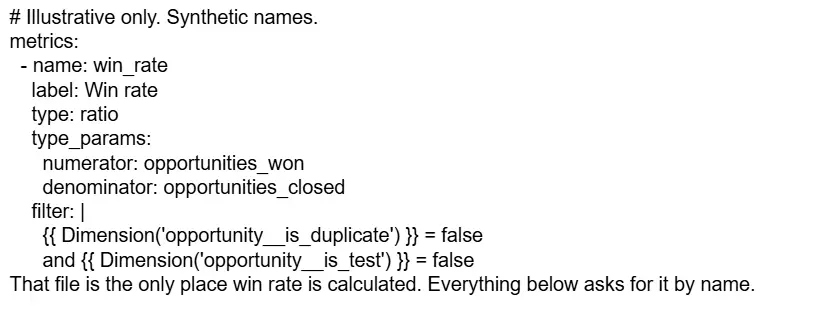
In Equative Insights OS the definition is written down exactly once: closed-won opportunities divided by all closed opportunities in the period, excluding records flagged as duplicates or internal tests. In MetricFlow, the open-source engine behind our semantic layer, that becomes a ratio metric in a reviewed YAML file:
The point isn’t that the numbers match. It’s that nobody had to check whether they would. There is no reconciliation step because there is nothing to reconcile: three surfaces, one request shape, one statement, one number.
Now the realistic part. Someone in finance notices that opportunities which were reopened and closed again are being counted twice in the denominator. The definition is wrong, and it is understating win rate.
In most organisations, fixing this means finding every place win rate is calculated: a calculated field in the BI tool, a saved query behind the board pack, and whatever an assistant or agent worked out for itself. Fix one and the other two now disagree with it by exactly the size of the fix. That is the worst kind of discrepancy, because each number looks right on its own.
In Equative Insights OS, the fix is a pull request against one file. Finance and the data owner review it. It is merged with a name, a date and a reason. On the next query, the chat answer, the dashboard tile and the API response all return the corrected figure, 36.0% (illustrative). Nobody rebuilt a dashboard, rewrote a prompt or emailed the teams consuming the API. The trace now shows the new definition version and who approved it.
Most people who rely on these numbers will never read the definition file, and they shouldn’t need to. What changes for them is simpler:
A semantic layer doesn’t make a bad definition good. It makes it visible, so the people who know the business can fix it once. It doesn’t remove the need for sales and finance to agree; it gives that agreement one place to live. And getting the same definitions into tools outside Equative depends on how widely the emerging open standard, Apache Ossie, is adopted. That is next Tuesday’s subject.
Define once. Answer anywhere. Change it in one place, with a name on the change.